
Collectible intelligence
Condition, price and sentiment analysis, built for institutional investors in alternative assets. We're developing a vision foundation model to read condition.
1 · Centering
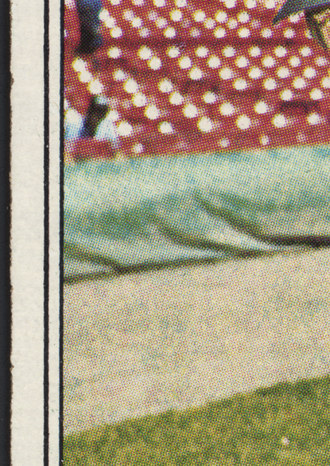
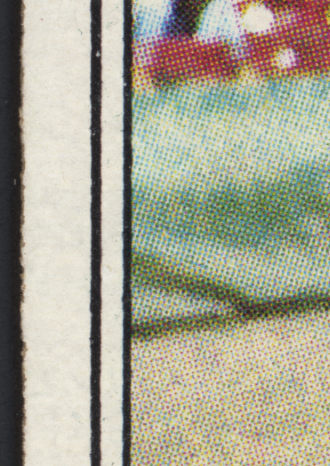
Measuring borders
Computer vision traces the cut edge, squares the card and measures every border.
- Left / right
- 45/55
- Top / bottom
- 55/45
Pink lines show where the border widths were read.



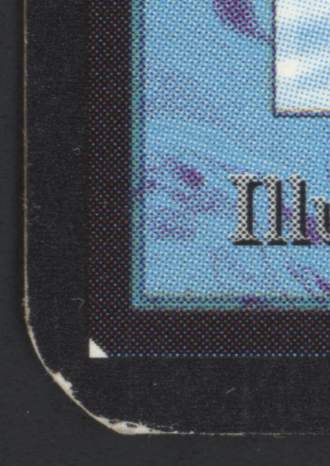
2 · Corners and edges
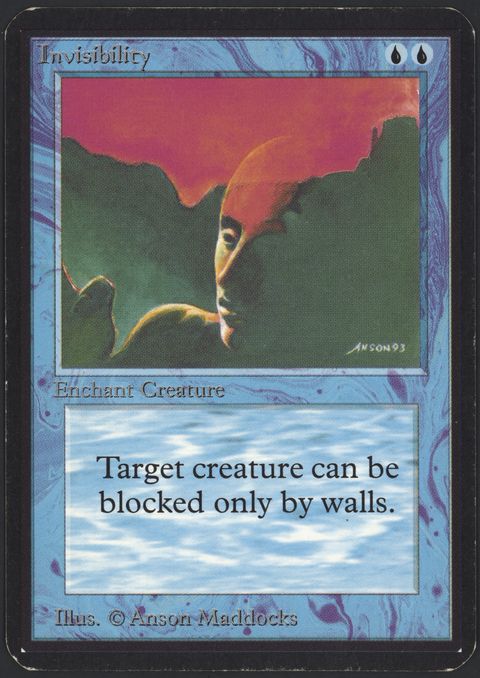
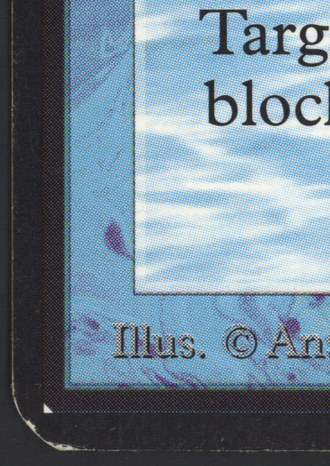
Finding edge wear
Computer vision finds the chips along the edge, so you see the wear before you buy.
Pink circles mark the chips and whitening along the edge.
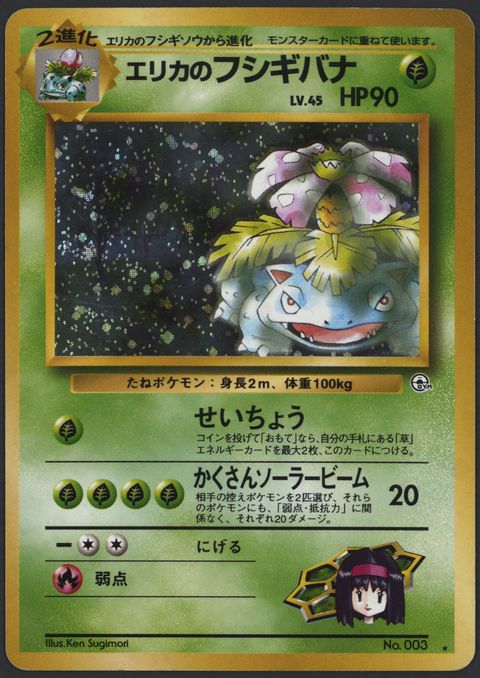
3 · Surface
Mapping scratches
Computer vision looks past the sparkle to find the scratches underneath.


Price analysis
Price time series analysis for collectibles.
- Time series
- Sale prices over time, by card and grade
- Volatility
- How far a card's price swings around its trend
- Grade premium
- At the top of the scale, one grade step can multiply a card's price
Sentiment analysis
Market sentiment analysis with large language models (LLMs).
- Signal
- What the collector market is saying, analyzed over time
- Catalysts
- Events that move sentiment, like a reprint, a new set or a player retiring
- Structural breaks
- Where a catalyst shifts a card's price series to a new level or trend
Condition analysis
Our computer vision pipeline.
- Centering
- How evenly the borders frame the card, side to side and top to bottom
- Corners and edges
- Chips and whitening around the rim
- Surface
- Scratches and specks, even under holo sparkle